The Ceasefire Is Priced In. The Normalization Lag Isn’t.
Iran Conflict Series — The 4-to-8-Week Hormuz Paradox


Earlier installments analyzed the initial conflict dynamics, the six-player payoff structure driving convergence, and the exit architecture from Day 7 onward. This piece focuses on what happens after the guns go quiet.
Key Takeaways:
Markets are trading “ceasefire vs. no ceasefire” as a binary. The real mispricing sits in the 4-to-8-week normalization lag between ceasefire and actual supply recovery. Even if a ceasefire is announced tomorrow, oil supply will not snap back the next day.
The normalization gap has four layers: insurance reinstatement (2–4 weeks), crew trust rebuilding, port queue clearance, and upstream production ramp-up. Each layer has its own time constant. Stacked together, 4 to 8 weeks is the floor estimate.
The critical distinction for allocators is between a “pulse” shock (oil spikes then reverts to $70–80) and a “step-function” shock (oil settles at a new $85–95 equilibrium). The pulse delays rate cuts by one quarter. The step-function puts the Fed into a fundamentally different regime.
Scenario B (slow normalization, oil at $80–95 for 3–4 months) is, in my assessment, both the most probable and the most under-priced scenario. The post-ceasefire rally is more likely a window to reduce exposure than a signal to add.
Watch List: Hormuz daily transit volume, P&I war-risk quotes, 5y5y breakeven inflation, Fed energy-risk language, OPEC output decisions, satellite confirmation of mine-laying activity.
The Signal Is What Iran Didn’t Do
Let me start with the conclusion.
The probability of a ceasefire is higher than the market priced during peak panic. That is precisely the problem.
From Day 1 to Day 9, I was not watching what Iran did. I was watching what Iran chose not to do. Drone strikes on tankers, IRGC rhetoric about closing the strait, missiles fired at Israel: all reversible. Drones are expendable. Ships get hit, insurance gets pulled, but the physical shipping lane remains intact.
What is not reversible is mining.
Once mines enter a shipping channel, a ceasefire cannot make them disappear. You need mine-clearing operations. You need time. And you can never confirm with 100% certainty that the strait is clean. So the fact that Iran chose drones over mines for the first nine days is itself a signal: they were preserving negotiating space.
But wars have their own escalation dynamics.
After Day 10, things shifted. CNN cited anonymous sources reporting that Iran had begun laying mines in the strait. The U.S. military subsequently claimed to have destroyed Iranian naval vessels, including 16 mine-laying boats. Trump responded on Truth Social with conditional language: “If Iran has laid mines, clear them immediately, or face consequences unlike anything seen before.”
There is a contradiction here. Trump claimed early in the conflict that Iran’s “navy has been destroyed.” So where did 16 boats come from? The answer is that the IRGC Navy does not rely on large surface combatants. It operates large numbers of small fast-attack craft and converted fishing vessels, dispersed across coastal harbors, difficult to eliminate in a single air campaign. But under full U.S.-Israeli air superiority with 24-hour satellite surveillance, large-scale systematic mining is nearly impossible. The destruction of 16 mine-laying boats itself demonstrates this.
The real question is the scale and intent of the mining. Small-scale mining and large-scale systematic mining are entirely different propositions. A handful of mines are not strategically irreversible, but their effect vastly exceeds their cost. Even the mere possibility forces every shipowner to assume the worst case. Mine-clearing confirmation alone costs weeks.
Iran may not even need to succeed at mining. The CNN headline “Iran begins mine-laying operations” accomplishes the objective by itself. Insurance companies will not reinstate coverage based on a single news report, but they will delay their underwriting reassessment because of one. This follows the same strategic logic as the drone blockade. You do not need to control the strait. You only need to control the fear of the strait.
Then consider Mojtaba Khamenei’s succession. The tension between short-term hardline demands and medium-term de-escalation needs pushes Iran’s behavior closer to the 2025 Twelve-Day War template: public denial paired with private negotiation.
Stack these signals together. My read is that ceasefire probability remains meaningful, likely higher than the market reflected at peak fear.
But here is the problem.
The Market Is Front-Running the Ceasefire. Nobody Is Doing the Math on What Comes After.
This is, from my perspective, the core section of the entire piece.
Everyone is trading the ceasefire. If it happens, oil drops. If it doesn’t, oil spikes. But the market has equated “ceasefire” with “back to normal,” and those two things are separated by at least 4 to 8 weeks of lag. Even if a ceasefire is announced tomorrow, oil supply does not recover the next day. Normalization faces four layers of obstacles, and each layer has its own time constant.
The first constraint is insurance reinstatement. P&I insurance (Protection & Indemnity, the mutual insurance covering shipowners) pulled war-risk coverage for the Hormuz Strait when the conflict began. Reinstating coverage is not a matter of issuing a press release. Underwriters need to reassess risk: confirming that military hostilities have ended, verifying shipping lane safety (if there are mining reports, mine-clearing confirmation itself takes time), then running internal underwriting processes. Conservative estimate: two to four weeks. With the mining headlines now in the picture, underwriting posture will be even more cautious.
The second is crew trust. International maritime law includes a provision called crew right of refusal, meaning crew members have the legal right to refuse to enter waters they deem dangerous. Even after insurance is reinstated, seafarer unions will need to renegotiate hazard-pay terms for high-risk zones. This is not an overnight administrative process.
Third, port rescheduling. Shipping tracking data suggests that over 150 vessels were stranded in and around the Persian Gulf during the conflict. After a ceasefire, these ships need to queue for port entry and departure, but port storage capacity across Gulf producing nations is already at capacity. Clearing this backlog alone takes weeks.
Fourth, upstream recovery. Reports indicate that Iraqi southern oil field output fell sharply during the conflict. (Note: specific production figures remain subject to source confirmation; the directional magnitude is large.) Oil fields are not faucets. Ramping from reduced output to full capacity requires staged pressurization, equipment inspection, and workforce redeployment. This process is measured in weeks.
Stack four layers together: even under optimistic assumptions, 4 to 8 weeks is the minimum normalization timeline. Factor in the possibility of small-scale mining, and mine-clearing confirmation adds another 2 to 4 weeks, stretching the window to 6 to 10 weeks.
Then there is the SPR math.
The U.S. Strategic Petroleum Reserve (SPR) has a maximum drawdown rate of roughly 2 million barrels per day. The supply gap from a Hormuz closure is approximately 20 million barrels per day. SPR covers 10% of the shortfall. This is not a problem that strategic reserves can solve. The IEA has held two emergency meetings in the past two weeks with no concrete action. Jawboning is losing credibility. The market is no longer buying it.
The Chris Wright incident is a perfect microcosm of this entire dynamic. The Energy Secretary posted on social media that the Navy had escorted oil tankers through the Hormuz Strait. WTI crude immediately plunged roughly 12% (source: Bloomberg, as of 2026/03/10), one of the sharpest single-day drops in recent years. Then the White House contradicted the statement. The post was deleted. Oil rebounded. Not a single tanker was actually escorted through. Nothing changed on the physical level.
This tells us two things. First, the market reacts to headlines orders of magnitude faster than physical supply recovers. Second, the market is desperate to believe good news; long oil positions are looking for any exit ramp. But if a single fake post can crash WTI by 12%, a single real tanker attack can pull it back 15%. Volatility cuts both ways.
Normalization of the strait does not depend on whether mines have been cleared. It depends on whether the market believes mines have been cleared. Perception recovers more slowly than reality. Insurance companies will not reinstate coverage because the Pentagon issued a statement. Shipowners will not dispatch vessels through the strait because CNN reported a ceasefire. They need to see actual transit records, sustained weeks of zero-incident data, independent mine-clearing confirmation reports.
⚠️ The oil price ranges and time estimates below are illustrative values used to explain the framework logic. Implementation requires calibration to individual risk tolerance, instrument set, and market conditions. Do not apply directly.
During this normalization lag, the oil price floor sits at roughly $80–90. This is not a premium that dissipates quickly.
The Butterfly Effect on Rate Cuts
How long oil stays elevated determines the inflation transmission path.
Here is a rough transmission timeline. Months 1–2: CPI headline gets pulled up approximately 0.3–0.5 percentage points directly by energy prices; core CPI absorbs indirect pressure through transportation and logistics costs. Months 3–4: the Fed is forced to insert energy-risk language into FOMC statements; markets begin repricing rate-cut expectations. Months 5–6: if inflation data confirms persistence at elevated levels, rate cuts are formally postponed.
The critical analytical move is distinguishing two fundamentally different paths.
The pulse path is oil spiking from the pre-conflict ~$63 to $90–100, then reverting to $70–80 after ceasefire and normalization. In this scenario, the base effect automatically suppresses year-over-year inflation readings 6 to 12 months later, because the prior-year comparison period is elevated. The first half of 2027 would actually create a larger rate-cut window than existed before the conflict.
The step-function path is oil spiking from $63 to $90–100 and then not reverting to $70–80, instead settling at a new equilibrium of $85–95. This could happen because OPEC discovers that high oil prices suit their interests and feels no urgency to restore output, or because the Hormuz insurance market undergoes a structural change that permanently elevates shipping costs. Under this scenario, the base effect is neutralized, and the Fed is forced to maintain a restrictive stance for longer.
For allocators, these two paths correspond to entirely different playbooks.
Under the pulse path, rate cuts are delayed by 3 to 6 months, but once the cutting cycle begins, it could run through Q2 2027. Short-term pain buys a longer easing runway in the medium term. This is a playbook you can wait for.
Under the step-function path, we enter a different regime. The Fed is stuck between elevated inflation and slowing growth, rate-cut magnitude is constrained, and the easing runway shrinks significantly.
Four monitoring triggers for the pulse-to-step-function transition:
Hormuz daily transit volume has not recovered to 50% four weeks after ceasefire.
OPEC chooses to maintain or deepen cuts at its first post-ceasefire meeting.
China attempts to establish an independent Persian Gulf transit corridor, altering the long-term shipping pricing structure.
SPR drawdown triggers refill demand that places a floor under oil prices.
If two of these four materialize simultaneously, the step-function probability rises sharply.
Three Worlds, Thirty Days After Ceasefire
⚠️ The scenario probabilities below are illustrative framework values intended to show relative weighting across different paths. They should not be used as trading signals. Probability ranges overlap slightly, reflecting genuine uncertainty at scenario boundaries. Ranges will be updated as events develop.
Scenario A — Rapid Convergence (probability ~20–25%)
Assumptions: ceasefire plus U.S. naval escort, DFC insurance mechanism activated, IRGC effective withdrawal. No mining confirmed, or mining attempts fully interdicted.
Oil returns to the $75–80 range within four weeks. Markets see a brief risk-on rally, but inflation data lags by two to three months and CPI remains elevated. A moderate correction likely follows in Q2. The Fed holds rates through Q4 2026, with cuts beginning in Q1 2027.
Monitoring indicators: Hormuz daily transit recovers above 80% within two weeks of ceasefire; P&I war-risk quotes begin declining within three weeks; IRGC public statements shift to de-escalatory language.
Scenario B — Slow Normalization (probability ~45–50%)
This is, in my assessment, both the most probable and the most under-priced scenario.
Assumptions: ceasefire achieved but insurance recovery slow; Hormuz transit volume reaches only 50–60% within three months. Possible small-scale mining uncertainty persists; mine-clearing confirmation delays the normalization timeline.
Oil stays in the $80–95 range for three to four months. Markets rally on the ceasefire, then spend two to three months gradually realizing the Fed will not cut on schedule. A 10–15% correction follows. This year’s equity low most likely falls two to three months after the ceasefire, when expectations are disappointed, not during the most intense phase of the war.
This is what I call the “normalization paradox.” The ceasefire is bullish, but the lag after the ceasefire is bearish. The market is trading the former while completely ignoring the latter.
Monitoring indicators: Hormuz transit recovery rate; P&I quotes still elevated three weeks post-ceasefire; OPEC meeting maintains output cuts; breakeven inflation continues rising.
Operationally, if a post-ceasefire rally materializes, it is more likely a window for some allocators to reduce exposure than a point to add. The more interesting entry point comes after the correction.
Scenario C — Normalization Failure (probability ~25–30%)
This scenario covers a broader range: from “ceasefire achieved but normalization fails” to “conflict continues escalating.”
Assumptions: ceasefire exists in name only or is never reached; mining independently confirmed with slow clearance progress; insurance market undergoes structural change.
Oil holds at $95–120 for six months or longer, following the step-function path. Recession pricing begins, equities correct 20%+ from highs, safe-haven capital flows into U.S. Treasuries. The Fed is trapped in a stagflationary bind: inflation too high to cut, growth too slow to hold.
Monitoring indicators: independent satellite imagery confirms mine deployment; mine-clearing operations begin but progress slower than expected; IRGC attacks continue after ceasefire; Saudi Aramco reduces export volumes.
Today’s Inflation Shock Is Tomorrow’s Rate-Cut Dividend
The market is treating ceasefire versus no-ceasefire as a binary trade. But the 4-to-8-week normalization lag after ceasefire is where the real mispricing sits. During this window, inflation data will run hot, rate-cut expectations will be pushed back, and markets will experience a correction triggered by disappointed expectations.
The counterintuitive angle: if this shock follows the pulse path (oil spikes then rapidly reverts), the elevated Q2–Q3 2026 oil prices create a high base. By Q1–Q2 2027, the base effect automatically compresses year-over-year inflation. The Fed’s rate-cut space would actually be larger than it was before the conflict.
In other words, this conflict delays the rate-cut timeline but may extend the rate-cutting runway.
⚠️ Markets make their largest errors on the time axis, not on direction. If normalization truly requires 6 to 8 weeks, then the ceasefire itself may mark the beginning of risk repricing, not the end.
For allocators, the cross-asset implications converge on a few judgments.
On U.S. Treasuries: bearish short-term, as yields rise during inflation-expectation re-anchoring. But if the pulse path confirms, long-duration Treasuries after Q4 2026 will offer a better entry point than before the conflict. This also means the time window from our earlier piece, The Positive Carry Hedge, will likely shift back.
On equities: the post-ceasefire rally is not the entry point. Under the Scenario B framework, the real entry comes after the correction, once the market has digested the fact that the Fed is not cutting.
On oil: if the pulse path confirms, the mean-reversion trade from highs back to $70–80 has a clean risk-reward structure. But until then, volatility is extreme. The Chris Wright incident showed that a single fake social media post can crash WTI by 12% in a single day. Short-duration, hard-stop-loss structures are the more reasonable approach.
These are not a trade list for you to copy. Position size, time horizon, and instrument set differ for everyone.
The first option is to wait. Maintain current positioning and let the normalization lag resolve before making judgments. The cost is enduring 2 to 3 months of volatility and uncertainty. This suits allocators whose exposure is already within reasonable bounds and who can tolerate short-term mark-to-market swings.
The second is to trim and wait for clarity. Reduce exposure during the ceasefire rally, hold cash, wait for the correction. The cost is that if Scenario A materializes, you miss the rapid-convergence rebound. This suits those with elevated exposure or a sub-six-month time horizon.
The third is to manage the tail with options. Buy downside protection while preserving upside participation. The cost is time-value decay; in a high-volatility environment, premiums are expensive. This suits those with derivatives capability who are willing to pay for certainty.
Signal Block: Monitoring Dashboard
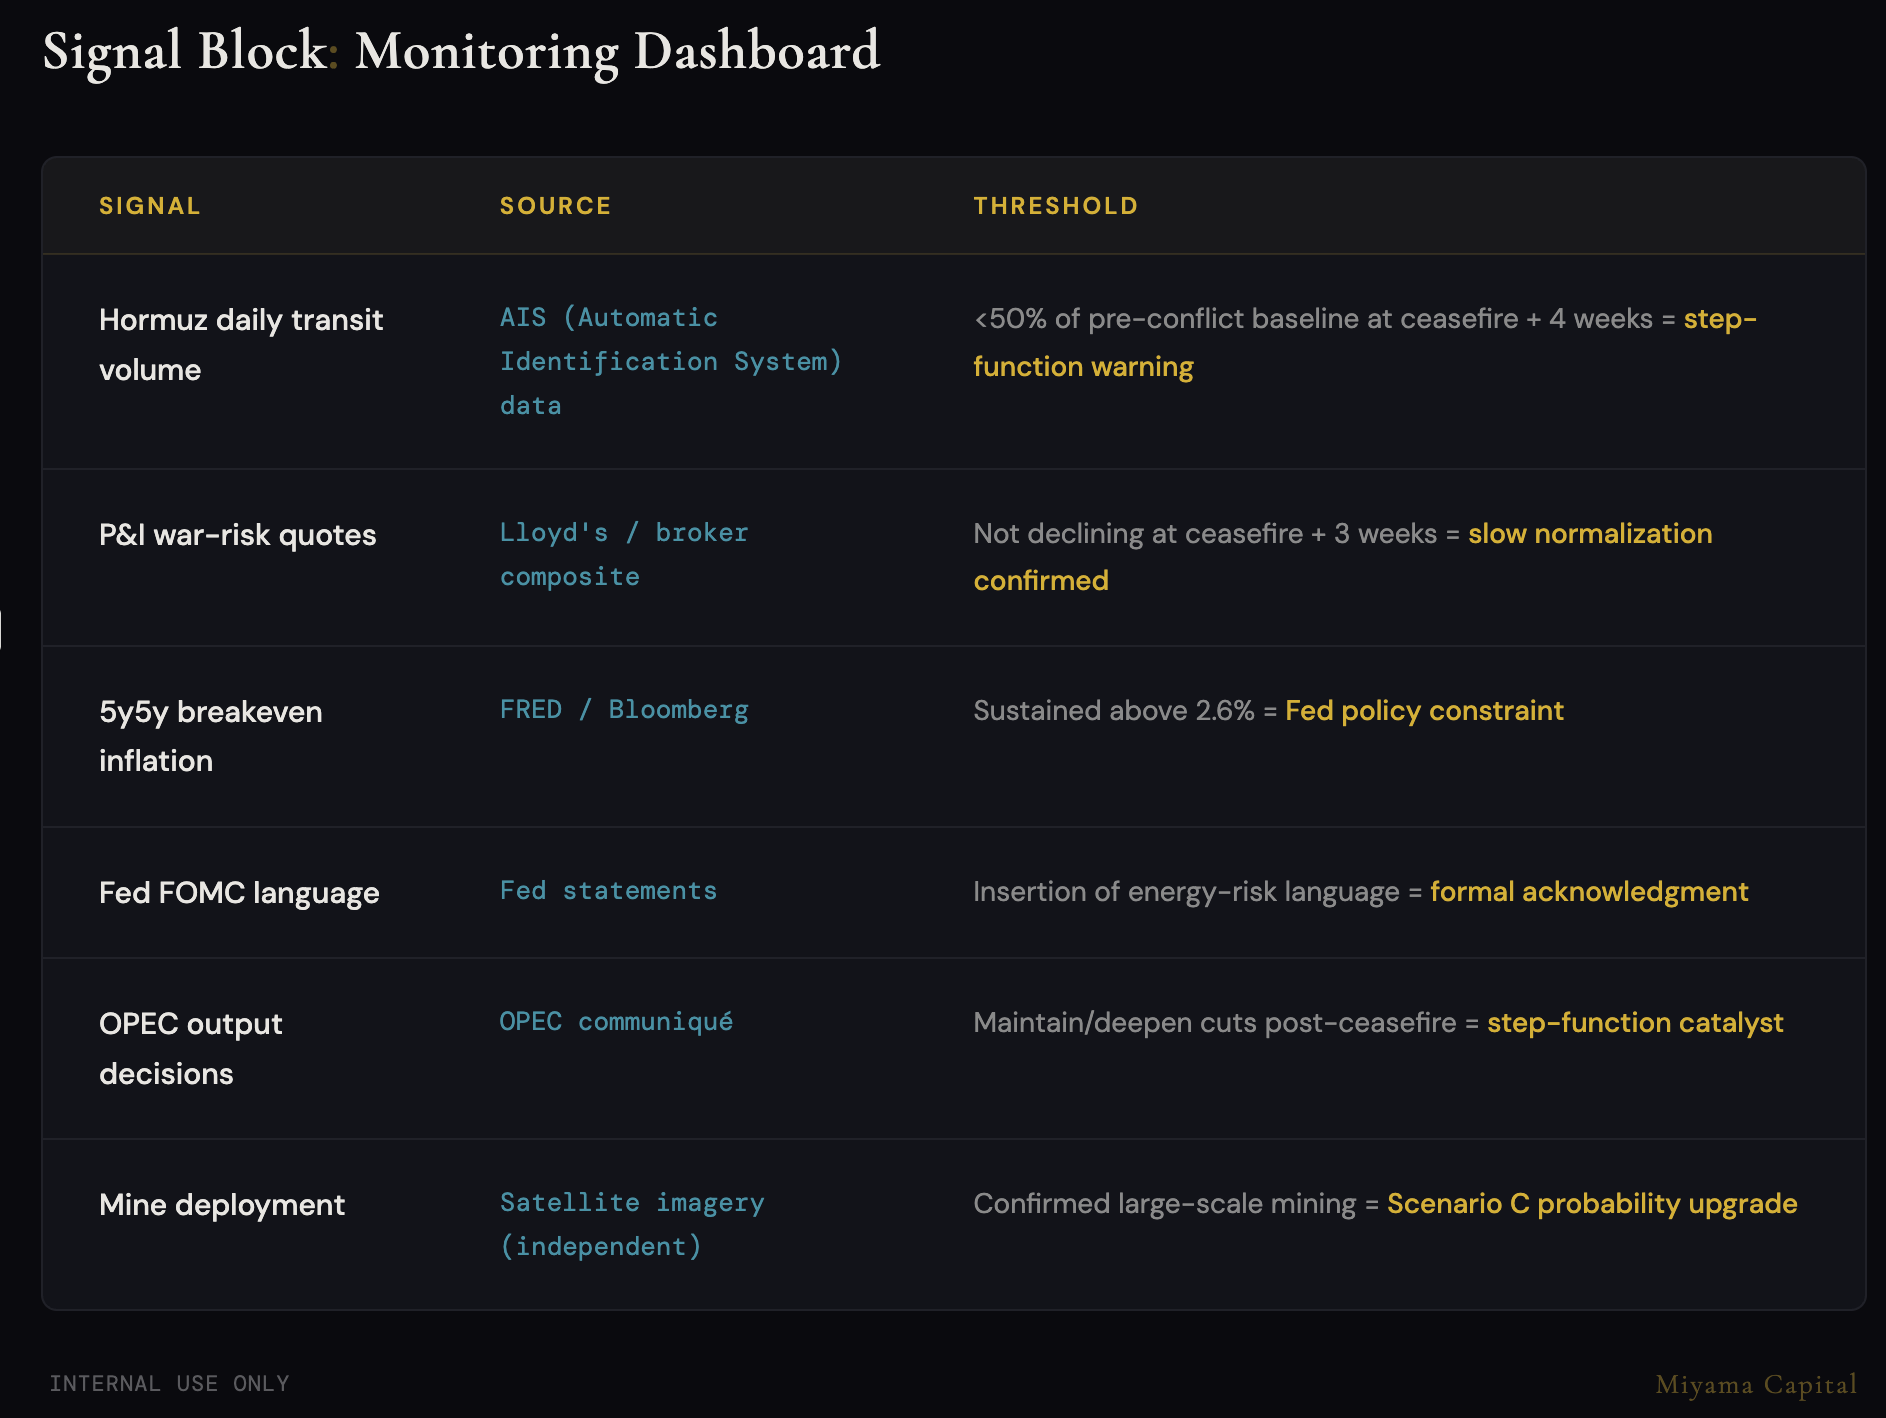
Regime Transition Triggers
Pulse to Step-Function: Two of the following four materialize simultaneously:
Hormuz transit volume below 50% at ceasefire + 4 weeks
OPEC maintains or deepens cuts
China establishes independent transit corridor, altering long-term pricing structure
SPR drawdown triggers refill demand, placing floor under oil
Mining Escalation Monitoring:
Independent satellite imagery confirms large-scale mine deployment → timeline extends beyond 3 months, Scenario C probability upgraded
Mine-clearing operations begin but progress slower than expected → Scenario B timeline extends to 6–10 weeks
Mining remains at headline level only, no independent confirmation → psychological impact only, minimal effect on physical timeline
Assumption Invalidation Trigger
If Hormuz transit volume recovers above 80% within two weeks of ceasefire, the 4-to-8-week lag assumption is invalidated and requires reassessment.
Disclaimer
This article reflects my personal investment philosophy. It is not investment advice. Make your own informed decisions.
Miyama Capital manages proprietary capital only and does not solicit external investors.
This memo represents the author’s personal views on macroeconomic conditions, interest rate environments, and asset allocation as of the date of writing. It does not constitute a solicitation, recommendation, or guarantee regarding the purchase or sale of any security, fund, bond, or other financial instrument. Investing involves risk; bond prices, interest rates, foreign exchange rates, and economic/policy conditions may materially affect asset values. Scenarios and instruments discussed may become inapplicable as market conditions change. Readers who make investment decisions based on this memo do so at their own risk, and the author accepts no liability for any gains or losses arising from the use or citation of this material.
Kuan, Founder & CIO, Miyama Capital