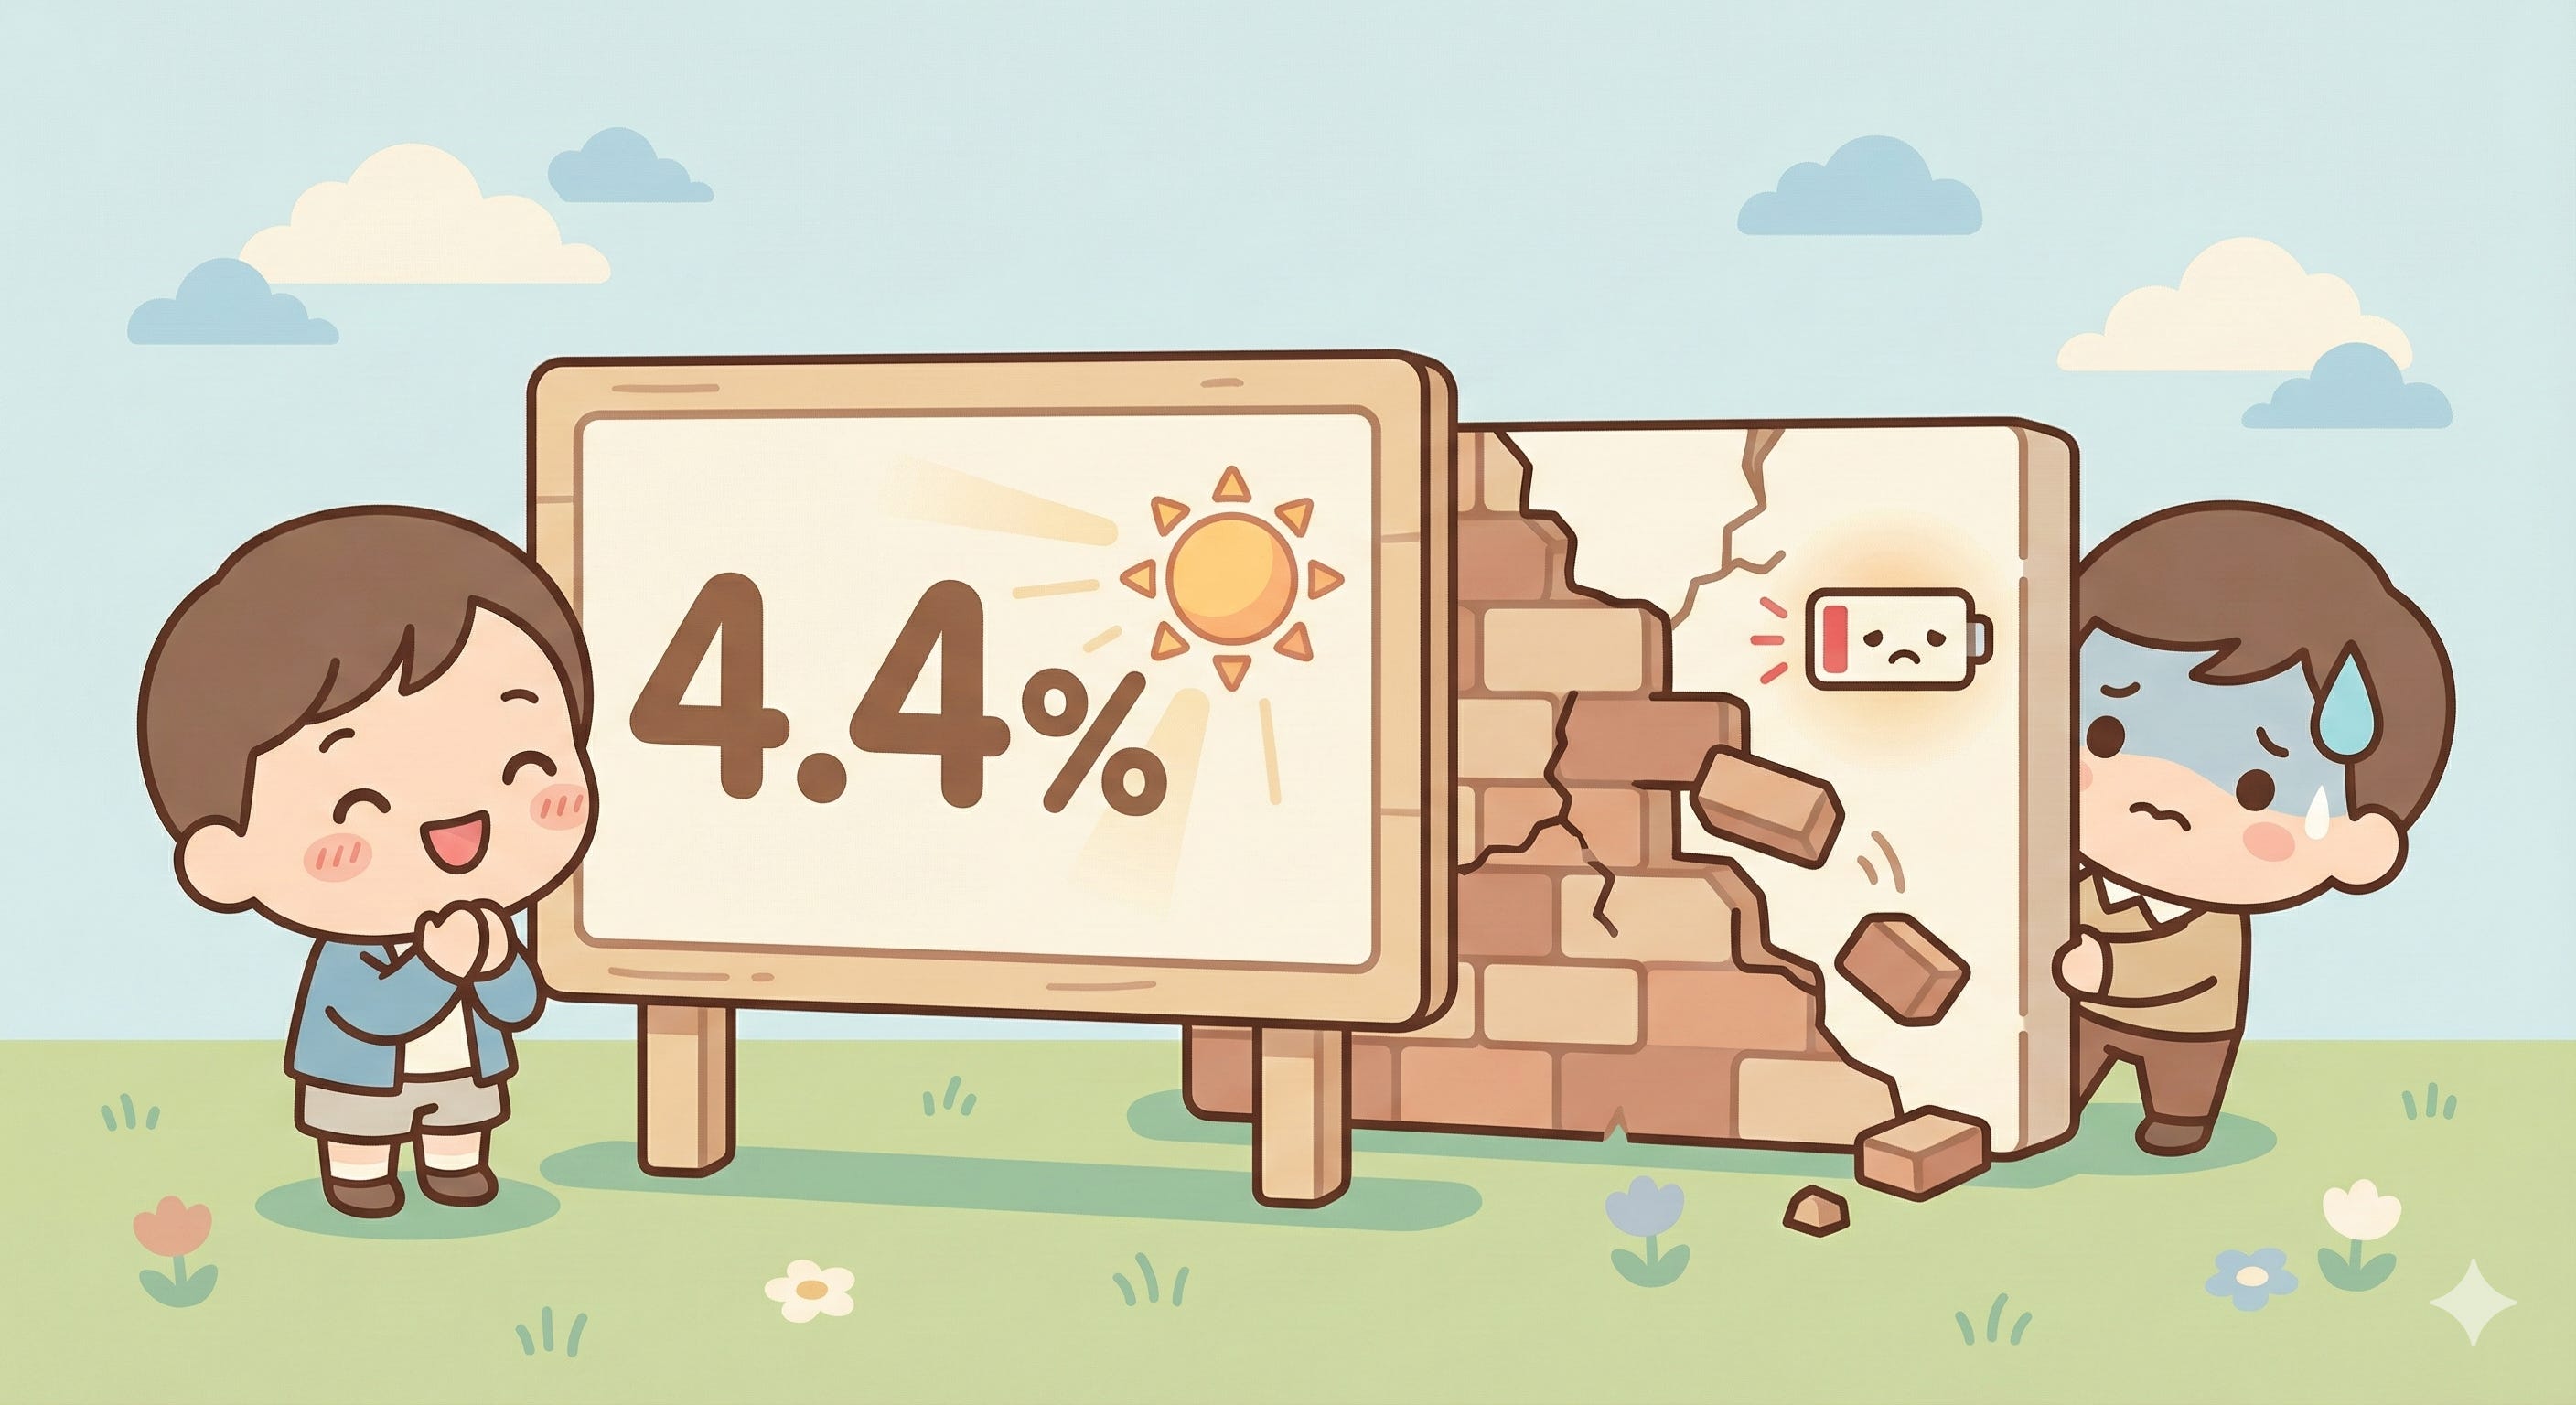
Mirage-like 4.4%: Why This Jobs Report Is the Fed’s Final Warning on Policy Timing
Holiday retail layoffs and shrinking private-sector momentum — why December’s jobs data could be the Fed’s last warning.

Executive summary
While markets cheered the headline drop in the unemployment rate from 4.5% to 4.4%, a closer look at components, distributions, and multi-month trends reveals a clear structural risk: private-sector expansion is fading, job gains are concentrated in defensive sectors, and cyclical and consumption-facing sectors are weakening. In this context the Federal Reserve’s greatest policy error would not be a directional mistake (raise vs. cut) so much as a timing mismatch — i.e., failing to loosen quickly enough. This note focuses on three core judgments:
The 4.4% headline likely masks internal deterioration;
Employment composition shows a K-shaped divergence (defensive vs. cyclical), signaling that the private-sector engine is losing thrust;
With inflation near target and nominal rates still elevated, a slow pace of rate cuts risks forcing a “passive tightening” that could deepen the downturn.
1) Don’t be fooled by 4.4%: statistical noise, composition effects, and rolling trends matter more
The 4.4% unemployment figure is a household-survey headline and is subject to monthly sampling volatility. The BLS itself emphasizes that establishment-survey monthly changes (for example, a net +50k payroll gain) can be statistically insignificant given normal variability. Thus a single monthly headline is a poor basis for concluding that the labor market has meaningfully re-strengthened.
Look instead at composition and multi-month trends:
Total job growth in 2025 collapsed to roughly +584k for the year, far below ~2.0m in 2024.
On a rolling, revised basis, the last three months’ net job creation is effectively flat to slightly negative (a near-zero/negative rolling trend).
Conclusion: the 4.4% number is more likely the result of short-term volatility and survey mechanics than a durable turning point. Investors relying on the headline risk misreading the economic cycle.
2) Structural change: defensive hiring masks cyclical weakness
December’s job gains were predominantly in health care, social assistance, and food services — sectors that are relatively rate-insensitive and reflect inelastic demand. By contrast, retail employment fell by roughly 25k in December, during the traditional holiday hiring season. This is not plausibly explained by a surge in temporary holiday hires; when firms choose to shrink staff in peak season, it is a concrete, conservative signal about near-term demand.
Manufacturing paints a complementary picture from the activity side: the ISM Manufacturing PMI has been below 50 for many months, indicating contraction. It is important to keep manufacturing’s PMI (a survey of activity) conceptually distinct from manufacturing payrolls (a level). The two usually move in the same direction over time, but with a lag — and the current activity weakness is consistent with a weaker employment outlook.
This mix — defensive industries propping up headline jobs while retail and cyclical sectors soften — is textbook late-cycle, K-shaped divergence: a handful of large/defensive firms expand while a broader base of firms, particularly small-and-mid retail and manufacturing businesses, retract.
3) Wages 3.8% — not necessarily a re-acceleration of inflation
Average hourly earnings rose ~3.8% year-over-year, which some interpret as renewed wage pressure. A more careful reading points to two mechanical drivers:
Composition effects — the exit of lower-paid retail and temporary workers raises the average wage of the remaining workforce;
Falling hours — average weekly hours have declined, so average hourly measures can rise while aggregate labor input is shrinking.
In short, a 3.8% increase in average hourly earnings does not equate to a broad-based wage-push inflation. Rather, it often signals “quantity contraction + compositional shift,” which is more damaging to corporate margins than it is informative about overheating wages. For firms, this is a recipe for margin compression — not an inflationary boom.
4) Real rates, passive tightening, and the Fed’s timing risk
Putting inflation and rates together clarifies the policy problem:
With CPI around ~2.7% year-over-year (core ~2.6%) and the upper bound of the federal funds rate roughly 3.50%–3.75%, a simple subtraction yields a rough real policy rate of ~1.0% (3.75 − 2.7 ≈ 1.05).
Even if this estimate is approximate, it implies a materially tightening real stance when job growth is flattening. Worse, if nominal rates remain unchanged while inflation drifts lower, real rates mechanically rise, creating what we call passive tightening.
Monetary policy operates with long and variable lags (6–12 months or more). If the labor market deterioration we already see is the product of earlier rate tightenings, then failing to accelerate easing now would increase the eventual human and economic cost: either policymakers will need to ease much more aggressively later, or a deeper economic contraction will materialize. Thus the Fed’s principal risk is a timing mismatch — moving too slowly relative to the pace of labor-market deterioration.
5) Why “not cutting now is a mistake” needs to be framed carefully
The intuition that the Fed risks policy error by moving too slowly is sound; however, that intuition should be couched as a rising probability and not a foregone conclusion. A precise framing is:
Evidence shows that policy-error risk is increasing due to internal labor-market deterioration (long-term unemployment and involuntary part-time work) concurrent with inflation’s descent toward target.
If inflation continues to fall and labor conditions worsen, the Fed should accelerate cuts to avoid passive tightening. If, instead, inflation reaccelerates (or inflation expectations rise), then holding fire on cuts is defensible.
Put differently: the policy error is conditional on how inflation and labor market indicators evolve over the coming months — it is scenario-dependent, not a deterministic outcome.
6) Three quantitative indicators investors should monitor
To separate noise from trend, we recommend watching:
Long-term unemployment (>27 weeks) and involuntary part-time employment — these are more reliable indicators of structural labor pain than the headline unemployment rate.
S&P 500 earnings-revision breadth by sector — persistent downward revision breadth concentrated in IT, Financials, and Professional Services would be direct evidence that a white-collar slowdown is eroding corporate profits.
Corporate guidance, retail same-store sales, and manufacturing new orders — these demand-side indicators are leading for profits and hiring, with small-and-mid-sized firms’ guidance especially informative.
Conclusion: from surface calm to a policy-timing alarm
December’s jobs report shows that a surface-level 4.4% unemployment rate does not equal a healthy labor market. Examined by component, distribution, and rolling trend, the private sector’s expansion is fading, long-term and hidden forms of unemployment are rising, and inflation is near the Fed’s target. Combined, these factors raise the probability that the Fed’s greatest error would be a timing error — a failure to ease soon enough, which would leave households and markets to absorb larger costs later.
The CPI release in mid-January and the labor and corporate guidance data in the months that follow will determine whether this risk crystallizes. If data continue to deteriorate while inflation cools, Miyama’s posture is clear: prioritize risk management; favor selective, high-conviction stock selection over inflated market exposure.
By Kuan | Miyama Capital
Disclosure: This note summarizes Miyama research views for informational purposes only and is not investment advice. Data references include public releases from the BLS, ISM, and CPI publications and have been interpreted and consolidated by the Miyama research team.